Atsitiktinis yra modulis, esantis NumPy bibliotekoje. Šiame modulyje yra funkcijos, kurios naudojamos atsitiktiniams skaičiams generuoti. Šiame modulyje yra keli paprasti atsitiktinių duomenų generavimo metodai, kai kurios permutacijos ir paskirstymo funkcijos bei atsitiktinių generatoriaus funkcijos.
Visos atsitiktinio modulio funkcijos yra tokios:
Paprasti atsitiktiniai duomenys
Yra šios paprastų atsitiktinių duomenų funkcijos:
1) p.random.rand(d0, d1, ..., dn)
Ši atsitiktinio modulio funkcija naudojama tam tikros formos atsitiktiniams skaičiams arba reikšmėms generuoti.
Pavyzdys:
import numpy as np a=np.random.rand(5,2) a
Išvestis:
css fonas
array([[0.74710182, 0.13306399], [0.01463718, 0.47618842], [0.98980426, 0.48390004], [0.58661785, 0.62895758], [0.38432729, 0.90384119]])
2) np.random.randn(d0, d1, ..., dn)
Ši atsitiktinio modulio funkcija grąžina pavyzdį iš „standartinio normalaus“ skirstinio.
Pavyzdys:
import numpy as np a=np.random.randn(2,2) a
Išvestis:
array([[ 1.43327469, -0.02019121], [ 1.54626422, 1.05831067]]) b=np.random.randn() b -0.3080190768904835
3) np.random.randint(žemas[, didelis, dydis, dtipas])
Ši atsitiktinio modulio funkcija naudojama atsitiktiniams sveikiesiems skaičiams generuoti nuo įtraukiančio (žemo) iki išskirtinio (didelio).
Pavyzdys:
import numpy as np a=np.random.randint(3, size=10) a
Išvestis:
array([1, 1, 1, 2, 0, 0, 0, 0, 0, 0])
4) np.random.random_integers(žemas[, didelis, dydis])
Ši atsitiktinio modulio funkcija naudojama generuoti atsitiktinius sveikuosius skaičius np.int tipo nuo mažo iki didelio.
Pavyzdys:
import numpy as np a=np.random.random_integers(3) a b=type(np.random.random_integers(3)) b c=np.random.random_integers(5, size=(3,2)) c
Išvestis:
2 array([[1, 1], [2, 5], [1, 3]])
5) np.random.random_sample([dydis])
Ši atsitiktinio modulio funkcija naudojama atsitiktiniam plūdės skaičiui generuoti pusiau atvirame intervale [0.0, 1.0).
Pavyzdys:
import numpy as np a=np.random.random_sample() a b=type(np.random.random_sample()) b c=np.random.random_sample((5,)) c
Išvestis:
0.09250360565571492 array([0.34665418, 0.47027209, 0.75944969, 0.37991244, 0.14159746])
6) np.random.random([dydis])
Ši atsitiktinio modulio funkcija naudojama atsitiktiniam plūdės skaičiui generuoti pusiau atvirame intervale [0.0, 1.0).
Pavyzdys:
import numpy as np a=np.random.random() a b=type(np.random.random()) b c=np.random.random((5,)) c
Išvestis:
0.008786953974334155 array([0.05530122, 0.59133394, 0.17258794, 0.6912388 , 0.33412534])
7) np.random.ranf([dydis])
Ši atsitiktinio modulio funkcija naudojama atsitiktiniam plūdės skaičiui generuoti pusiau atvirame intervale [0.0, 1.0).
Pavyzdys:
import numpy as np a=np.random.ranf() a b=type(np.random.ranf()) b c=np.random.ranf((5,)) c
Išvestis:
0.2907792098474542 array([0.34084881, 0.07268237, 0.38161256, 0.46494681, 0.88071377])
8) np.random.sample([dydis])
Ši atsitiktinio modulio funkcija naudojama atsitiktiniam plūdės skaičiui generuoti pusiau atvirame intervale [0.0, 1.0).
Pavyzdys:
import numpy as np a=np.random.sample() a b=type(np.random.sample()) b c=np.random.sample((5,)) c
Išvestis:
0.012298209913766511 array([0.71878544, 0.11486169, 0.38189074, 0.14303308, 0.07217287])
9) np.random.choice(a[, dydis, pakeisti, p])
Ši atsitiktinio modulio funkcija naudojama generuoti atsitiktinį pavyzdį iš nurodyto 1-D masyvo.
Pavyzdys:
import numpy as np a=np.random.choice(5,3) a b=np.random.choice(5,3, p=[0.2, 0.1, 0.4, 0.2, 0.1]) b
Išvestis:
array([0, 3, 4]) array([2, 2, 2], dtype=int64)
10) np.random.bytes (ilgis)
Ši atsitiktinio modulio funkcija naudojama atsitiktiniams baitams generuoti.
Pavyzdys:
import numpy as np a=np.random.bytes(7) a
Išvestis:
'nQx08x83xf9xdex8a'
Permutacijos
Yra šios permutacijų funkcijos:
1) np.random.shuffle()
Ši funkcija naudojama norint pakeisti seką, maišant jos turinį.
Pavyzdys:
import numpy as np a=np.arange(12) a np.random.shuffle(a) a
Išvestis:
array([ 0, 1, 2, 3, 4, 5, 6, 7, 8, 9, 10, 11]) array([10, 3, 2, 4, 5, 8, 0, 9, 1, 11, 7, 6])
2) np.random.permutation()
Ši funkcija permutuoja seką atsitiktinai arba grąžina permutuotą diapazoną.
Pavyzdys:
import numpy as np a=np.random.permutation(12) a
Išvestis:
array([ 8, 7, 3, 11, 6, 0, 9, 10, 2, 5, 4, 1])
Paskirstymai
Yra šios permutacijų funkcijos:
1) beta (a, b[, dydis])
Ši funkcija naudojama imti pavyzdžius iš beta paskirstymo.
Pavyzdys:
def setup(self): self.dist = dist.beta self.cargs = [] self.ckwd = dict(alpha=2, beta=3) self.np_rand_fxn = numpy.random.beta self.np_args = [2, 3] self.np_kwds = dict()
2) dvejetainis (n, p[, dydis])
Ši funkcija naudojama imti iš dvinario skirstinio.
Pavyzdys:
import numpy as np n, p = 10, .6 s1= np.random.binomial(n, p, 10) s1
Išvestis:
array([6, 7, 7, 9, 3, 7, 8, 6, 6, 4])
3) chisquare (df[, dydis])
Ši funkcija naudojama imti iš dvinario skirstinio.
Pavyzdys:
import numpy as np np.random.chisquare(2,4) sum(np.random.binomial(9, 0.1, 20000) == 0)/20000.
Išvestis:
array([6, 7, 7, 9, 3, 7, 8, 6, 6, 4])
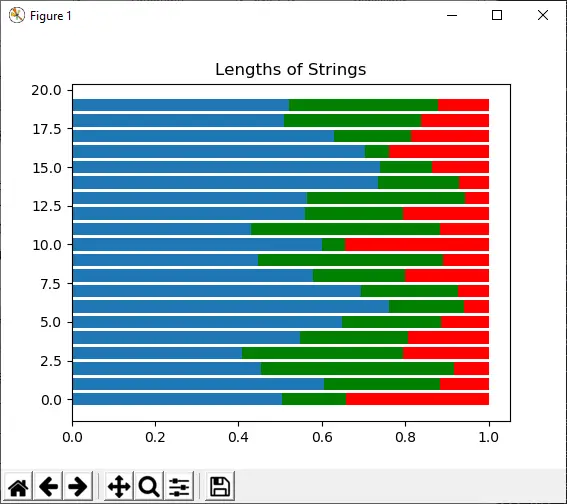
4) dirichletas (alfa[, dydis])
Ši funkcija naudojama imti iš Dirichlet skirstinio.
Pavyzdys:
Import numpy as np import matplotlib.pyplot as plt s1 = np.random.dirichlet((10, 5, 3), 20).transpose() plt.barh(range(20), s1[0]) plt.barh(range(20), s1[1], left=s1[0], color='g') plt.barh(range(20), s1[2], left=s1[0]+s1[1], color='r') plt.title('Lengths of Strings') plt.show()
Išvestis:
5) eksponentinis ([mastas, dydis])
Ši funkcija naudojama imti iš eksponentinės skirstinio.
Pavyzdys:
def __init__(self, sourceid, targetid): self.__type = 'Transaction' self.id = uuid4() self.source = sourceid self.target = targetid self.date = self._datetime.date(start=2015, end=2019) self.time = self._datetime.time() if random() <0.05: self.amount="self._numbers.between(100000," 1000000) if random() < 0.15: self.currency="self._business.currency_iso_code()" else: pre> <p> <strong>6) f(dfnum, dfden[, size])</strong> </p> <p>This function is used to draw sample from an F distribution.</p> <p> <strong>Example:</strong> </p> <pre> import numpy as np dfno= 1. dfden = 48. s1 = np.random.f(dfno, dfden, 10) np.sort(s1) </pre> <p> <strong>Output:</strong> </p> <pre> array([0.00264041, 0.04725478, 0.07140803, 0.19526217, 0.23979 , 0.24023478, 0.63141254, 0.95316446, 1.40281789, 1.68327507]) </pre> <p> <strong>7) gamma(shape[, scale, size])</strong> </p> <p>This function is used to draw sample from a Gamma distribution </p> <p> <strong>Example:</strong> </p> <pre> import numpy as np shape, scale = 2., 2. s1 = np.random.gamma(shape, scale, 1000) import matplotlib.pyplot as plt import scipy.special as spss count, bins, ignored = plt.hist(s1, 50, density=True) a = bins**(shape-1)*(np.exp(-bins/scale) / (spss.gamma(shape)*scale**shape)) plt.plot(bins, a, linewidth=2, color='r') plt.show() </pre> <img src="//techcodeview.com/img/numpy-tutorial/36/numpy-random-python-2.webp" alt="numpy.random in Python"> <p> <strong>8) geometric(p[, size])</strong> </p> <p>This function is used to draw sample from a geometric distribution. </p> <p> <strong>Example:</strong> </p> <pre> import numpy as np a = np.random.geometric(p=0.35, size=10000) (a == 1).sum() / 1000 </pre> <p> <strong>Output:</strong> </p> <pre> 3. </pre> <p> <strong>9) gumbel([loc, scale, size])</strong> </p> <p>This function is used to draw sample from a Gumble distribution.</p> <p> <strong>Example:</strong> </p> <pre> import numpy as np lov, scale = 0, 0.2 s1 = np.random.gumbel(loc, scale, 1000) import matplotlib.pyplot as plt count, bins, ignored = plt.hist(s1, 30, density=True) plt.plot(bins, (1/beta)*np.exp(-(bins - loc)/beta)* np.exp( -np.exp( -(bins - loc) /beta) ),linewidth=2, color='r') plt.show() </pre> <p> <strong>Output:</strong> </p> <img src="//techcodeview.com/img/numpy-tutorial/36/numpy-random-python-3.webp" alt="numpy.random in Python"> <p> <strong>10) hypergeometric(ngood, nbad, nsample[, size])</strong> </p> <p>This function is used to draw sample from a Hypergeometric distribution. </p> <p> <strong>Example:</strong> </p> <pre> import numpy as np good, bad, samp = 100, 2, 10 s1 = np.random.hypergeometric(good, bad, samp, 1000) plt.hist(s1) plt.show() </pre> <p> <strong>Output:</strong> </p> <pre> (array([ 13., 0., 0., 0., 0., 163., 0., 0., 0., 824.]), array([ 8. , 8.2, 8.4, 8.6, 8.8, 9. , 9.2, 9.4, 9.6, 9.8, 10. ]), <a 10 list of patch objects>) </a></pre> <p><img src="//techcodeview.com/img/numpy-tutorial/36/numpy-random-python-4.webp" alt="numpy.random in Python"></p> <p> <strong>11) laplace([loc, scale, size])</strong> </p> <p>This function is used to draw sample from the Laplace or double exponential distribution with specified location and scale.</p> <p> <strong>Example:</strong> </p> <pre> import numpy as np location, scale = 0., 2. s = np.random.laplace(location, scale, 10) s </pre> <p> <strong>Output:</strong> </p> <pre> array([-2.77127948, -1.46401453, -0.03723516, -1.61223942, 2.29590691, 1.74297722, 1.49438411, 0.30325513, -0.15948891, -4.99669747]) </pre> <p> <strong>12) logistic([loc, scale, size])</strong> </p> <p>This function is used to draw sample from logistic distribution. </p> <p> <strong>Example:</strong> </p> <pre> import numpy as np import matplotlib.pyplot as plt location, scale = 10, 1 s1 = np.random.logistic(location, scale, 10000) count, bins, ignored = plt.hist(s1, bins=50) count bins ignored plt.show() </pre> <p> <strong>Output:</strong> </p> <pre> array([1.000e+00, 1.000e+00, 1.000e+00, 0.000e+00, 1.000e+00, 1.000e+00, 1.000e+00, 5.000e+00, 7.000e+00, 1.100e+01, 1.800e+01, 3.500e+01, 5.300e+01, 6.700e+01, 1.150e+02, 1.780e+02, 2.300e+02, 3.680e+02, 4.910e+02, 6.400e+02, 8.250e+02, 9.100e+02, 9.750e+02, 1.039e+03, 9.280e+02, 8.040e+02, 6.530e+02, 5.240e+02, 3.380e+02, 2.470e+02, 1.650e+02, 1.150e+02, 8.500e+01, 6.400e+01, 3.300e+01, 1.600e+01, 2.400e+01, 1.400e+01, 4.000e+00, 5.000e+00, 2.000e+00, 2.000e+00, 1.000e+00, 1.000e+00, 0.000e+00, 1.000e+00, 0.000e+00, 0.000e+00, 0.000e+00, 1.000e+00]) array([ 0.50643911, 0.91891814, 1.33139717, 1.7438762 , 2.15635523, 2.56883427, 2.9813133 , 3.39379233, 3.80627136, 4.2187504 , 4.63122943, 5.04370846, 5.45618749, 5.86866652, 6.28114556, 6.69362459, 7.10610362, 7.51858265, 7.93106169, 8.34354072, 8.75601975, 9.16849878, 9.58097781, 9.99345685, 10.40593588, 10.81841491, 11.23089394, 11.64337298, 12.05585201, 12.46833104, 12.88081007, 13.2932891 , 13.70576814, 14.11824717, 14.5307262 , 14.94320523, 15.35568427, 15.7681633 , 16.18064233, 16.59312136, 17.00560039, 17.41807943, 17.83055846, 18.24303749, 18.65551652, 19.06799556, 19.48047459, 19.89295362, 20.30543265, 20.71791168, 21.13039072]) <a 50 list of patch objects> </a></pre> <p><img src="//techcodeview.com/img/numpy-tutorial/36/numpy-random-python-5.webp" alt="numpy.random in Python"></p> <p> <strong>13) lognormal([mean, sigma, size])</strong> </p> <p>This function is used to draw sample from a log-normal distribution.</p> <p> <strong>Example:</strong> </p> <pre> import numpy as np mu, sigma = 2., 1. s1 = np.random.lognormal(mu, sigma, 1000) import matplotlib.pyplot as plt count, bins, ignored = plt.hist(s1, 100, density=True, ) a = np.linspace(min(bins), max(bins), 10000) pdf = (np.exp(-(np.log(a) - mu)**2 / (2 * sigma**2))/ (a * sigma * np.sqrt(2 * np.pi))) plt.plot(a, pdf, linewidth=2, color='r') plt.axis('tight') plt.show() </pre> <p> <strong>Output:</strong> </p> <img src="//techcodeview.com/img/numpy-tutorial/36/numpy-random-python-6.webp" alt="numpy.random in Python"> <p> <strong>14) logseries(p[, size])</strong> </p> <p>This function is used to draw sample from a logarithmic distribution. </p> <p> <strong>Example:</strong> </p> <pre> import numpy as np x = .6 s1 = np.random.logseries(x, 10000) count, bins, ignored = plt.hist(s1) def logseries(k, p): return -p**k/(k*log(1-p)) plt.plot(bins, logseries(bins, x)*count.max()/logseries(bins, a).max(), 'r') plt.show() </pre> <p> <strong>Output:</strong> </p> <img src="//techcodeview.com/img/numpy-tutorial/36/numpy-random-python-7.webp" alt="numpy.random in Python"> <p> <strong>15) multinomial(n, pvals[, size])</strong> </p> <p>This function is used to draw sample from a multinomial distribution. </p> <p> <strong>Example:</strong> </p> <pre> import numpy as np np.random.multinomial(20, [1/6.]*6, size=1) </pre> <p> <strong>Output:</strong> </p> <pre> array([[4, 2, 5, 5, 3, 1]]) </pre> <p> <strong>16) multivariate_normal(mean, cov[, size, ...)</strong> </p> <p>This function is used to draw sample from a multivariate normal distribution. </p> <p> <strong>Example:</strong> </p> <pre> import numpy as np mean = (1, 2) coveriance = [[1, 0], [0, 100]] import matplotlib.pyplot as plt a, b = np.random.multivariate_normal(mean, coveriance, 5000).T plt.plot(a, b, 'x') plt.axis('equal'023 030 ) plt.show() </pre> <p> <strong>Output:</strong> </p> <img src="//techcodeview.com/img/numpy-tutorial/36/numpy-random-python-8.webp" alt="numpy.random in Python"> <p> <strong>17) negative_binomial(n, p[, size])</strong> </p> <p>This function is used to draw sample from a negative binomial distribution. </p> <p> <strong>Example:</strong> </p> <pre> import numpy as np s1 = np.random.negative_binomial(1, 0.1, 100000) for i in range(1, 11): probability = sum(s1 <i) 36 100000. print i, 'wells drilled, probability of one success=", probability </pre> <p> <strong>Output:</strong> </p> <pre> 1 wells drilled, probability of one success = 0 2 wells drilled, probability of one success = 0 3 wells drilled, probability of one success = 0 4 wells drilled, probability of one success = 0 5 wells drilled, probability of one success = 0 6 wells drilled, probability of one success = 0 7 wells drilled, probability of one success = 0 8 wells drilled, probability of one success = 0 9 wells drilled, probability of one success = 0 10 wells drilled, probability of one success = 0 </pre> <p > <strong>18) noncentral_chisquare(df, nonc[, size])</strong> </p> <p>This function is used to draw sample from a noncentral chi-square distribution. </p> <p> <strong>Example:</strong> </p> <pre> import numpy as np import matplotlib.pyplot as plt val = plt.hist(np.random.noncentral_chisquare(3, 25, 100000), bins=200, normed=True) plt.show() </pre> <p> <strong>Output:</strong> </p> <img src=" techcodeview.com img numpy-tutorial numpy-random-python-9.webp' alt="numpy.random in Python"> <p> <strong>19) normal([loc, scale, size])</strong> </p> <p>This function is used to draw sample from a normal distribution.</p> <p> <strong>Example:</strong> </p> <pre> import numpy as np import matplotlib.pyplot as plt mu, sigma = 0, 0.2 # mean and standard deviation s1 = np.random.normal(mu, sigma, 1000) abs(mu - np.mean(s1)) <0.01 1 abs(sigma - np.std(s1, ddof="1))" < 0.01 count, bins, ignored="plt.hist(s1," 30, density="True)" plt.plot(bins, (sigma * np.sqrt(2 np.pi)) *np.exp( (bins mu)**2 (2 sigma**2) ), linewidth="2," color="r" ) plt.show() pre> <p> <strong>Output:</strong> </p> <img src="//techcodeview.com/img/numpy-tutorial/36/numpy-random-python-10.webp" alt="numpy.random in Python"> <p> <strong>20) pareto(a[, size])</strong> </p> <p>This function is used to draw samples from a Lomax or Pareto II with specified shape.</p> <p> <strong>Example:</strong> </p> <pre> import numpy as np import matplotlib.pyplot as plt b, m1 = 3., 2. # shape and mode s1 = (np.random.pareto(b, 1000) + 1) * m1 count, bins, _ = plt.hist(s1, 100, density=True) fit = b*m**b / bins**(b+1) plt.plot(bins, max(count)*fit/max(fit), linewidth=2, color='r') plt.show() </pre> <p> <strong>Output:</strong> </p> <img src="//techcodeview.com/img/numpy-tutorial/36/numpy-random-python-11.webp" alt="numpy.random in Python"> <p> <strong>21) power(a[, size])</strong> </p> <p>This function is used to draw samples in [0, 1] from a power distribution with positive exponent a-1.</p> <p> <strong>Example:</strong> </p> <pre> import numpy as np x = 5. # shape samples = 1000 s1 = np.random.power(x, samples) import matplotlib.pyplot as plt count, bins, ignored = plt.hist(s1, bins=30) a = np.linspace(0, 1, 100) b = x*a**(x-1.) density_b = samples*np.diff(bins)[0]*b plt.plot(a, density_b) plt.show() </pre> <p> <strong>Output:</strong> </p> <img src="//techcodeview.com/img/numpy-tutorial/36/numpy-random-python-12.webp" alt="numpy.random in Python"> <p> <strong>22) rayleigh([scale, size])</strong> </p> <p>This function is used to draw sample from a Rayleigh distribution.</p> <p> <strong>Example:</strong> </p> <pre> val = hist(np.random.rayleigh(3, 100000), bins=200, density=True) meanval = 1 modeval = np.sqrt(2 / np.pi) * meanval s1 = np.random.rayleigh(modeval, 1000000) 100.*sum(s1>3)/1000000. </pre> <p> <strong>Output:</strong> </p> <pre> 0.087300000000000003 </pre> <p><img src="//techcodeview.com/img/numpy-tutorial/36/numpy-random-python-13.webp" alt="numpy.random in Python"></p> <p> <strong>23) standard_cauchy([size])</strong> </p> <p>This function is used to draw sample from a standard Cauchy distribution with mode=0.</p> <p> <strong>Example:</strong> </p> <pre> import numpy as np import matplotlib.pyplot as plt s1 = np.random.standard_cauchy(1000000) s1 = s1[(s1>-25) & (s1<25)] # truncate distribution so it plots well plt.hist(s1, bins="100)" plt.show() < pre> <p> <strong>Output:</strong> </p> <img src="//techcodeview.com/img/numpy-tutorial/36/numpy-random-python-14.webp" alt="numpy.random in Python"> <p> <strong>24) standard_exponential([size])</strong> </p> <p>This function is used to draw sample from a standard exponential distribution.</p> <p> <strong>Example:</strong> </p> <pre> import numpy as np n = np.random.standard_exponential((2, 7000)) </pre> <p> <strong>Output:</strong> </p> <pre> array([[0.53857931, 0.181262 , 0.20478701, ..., 3.66232881, 1.83882709, 1.77963295], [0.65163973, 1.40001955, 0.7525986 , ..., 0.76516523, 0.8400617 , 0.88551011]]) </pre> <p> <strong>25) standard_gamma([size])</strong> </p> <p>This function is used to draw sample from a standard Gamma distribution.</p> <p> <strong>Example:</strong> </p> <pre> import numpy as np shape, scale = 2., 1. s1 = np.random.standard_gamma(shape, 1000000) import matplotlib.pyplot as plt import scipy.special as sps count1, bins1, ignored1 = plt.hist(s, 50, density=True) y = bins1**(shape-1) * ((np.exp(-bins1/scale))/ (sps.gamma(shape) * scale**shape)) plt.plot(bins1, y, linewidth=2, color='r') plt.show() </pre> <p> <strong>Output:</strong> </p> <img src="//techcodeview.com/img/numpy-tutorial/36/numpy-random-python-15.webp" alt="numpy.random in Python"> <p> <strong>26) standard_normal([size])</strong> </p> <p>This function is used to draw sample from a standard Normal distribution.</p> <p> <strong>Example:</strong> </p> <pre> import numpy as np import matplotlib.pyplot as plt s1= np.random.standard_normal(8000) s1 q = np.random.standard_normal(size=(3, 4, 2)) q </pre> <p> <strong>Output:</strong> </p> <pre> array([-3.14907597, 0.95366265, -1.20100026, ..., 3.47180222, 0.9608679 , 0.0774319 ]) array([[[ 1.55635461, -1.29541713], [-1.50534663, -0.02829194], [ 1.03949348, -0.26128132], [ 1.51921798, 0.82136178]], [[-0.4011052 , -0.52458858], [-1.31803814, 0.37415379], [-0.67077365, 0.97447018], [-0.20212115, 0.67840888]], [[ 1.86183474, 0.19946562], [-0.07376021, 0.84599701], [-0.84341386, 0.32081667], [-3.32016062, -1.19029818]]]) </pre> <p> <strong>27) standard_t(df[, size])</strong> </p> <p>This function is used to draw sample from a standard Student's distribution with df degree of freedom.</p> <p> <strong>Example:</strong> </p> <pre> intake = np.array([5260., 5470, 5640, 6180, 6390, 6515, 6805, 7515,8230,8770]) s1 = np.random.standard_t(10, size=100000) np.mean(intake) intake.std(ddof=1) t = (np.mean(intake)-7725)/(intake.std(ddof=1)/np.sqrt(len(intake))) h = plt.hist(s1, bins=100, density=True) np.sum(s1<t) float(len(s1)) plt.show() < pre> <p> <strong>Output:</strong> </p> <pre> 6677.5 1174.1101831694598 0.00864 </pre> <p><img src="//techcodeview.com/img/numpy-tutorial/36/numpy-random-python-16.webp" alt="numpy.random in Python"></p> <p> <strong>28) triangular(left, mode, right[, size])</strong> </p> <p>This function is used to draw sample from a triangular distribution over the interval.</p> <p> <strong>Example:</strong> </p> <pre> import numpy as np import matplotlib.pyplot as plt h = plt.hist(np.random.triangular(-4, 0, 8, 1000000), bins=300,density=True) plt.show() </pre> <p> <strong>Output:</strong> </p> <img src="//techcodeview.com/img/numpy-tutorial/36/numpy-random-python-17.webp" alt="numpy.random in Python"> <p> <strong>29) uniform([low, high, size])</strong> </p> <p>This function is used to draw sample from a uniform distribution.</p> <p> <strong>Example:</strong> </p> <pre> import numpy as np import matplotlib.pyplot as plt s1 = np.random.uniform(-1,0,1000) np.all(s1 >= -1) np.all(s1 <0) count, bins, ignored="plt.hist(s1," 15, density="True)" plt.plot(bins, np.ones_like(bins), linewidth="2," color="r" ) plt.show() < pre> <p> <strong>Output:</strong> </p> <img src="//techcodeview.com/img/numpy-tutorial/36/numpy-random-python-18.webp" alt="numpy.random in Python"> <p> <strong>30) vonmises(m1, m2[, size])</strong> </p> <p>This function is used to draw sample from a von Mises distribution.</p> <p> <strong>Example:</strong> </p> <pre> import numpy as np import matplotlib.pyplot as plt m1, m2 = 0.0, 4.0 s1 = np.random.vonmises(m1, m2, 1000) from scipy.special import i0 plt.hist(s1, 50, density=True) x = np.linspace(-np.pi, np.pi, num=51) y = np.exp(m2*np.cos(x-m1))/(2*np.pi*i0(m2)) plt.plot(x, y, linewidth=2, color='r') plt.show() </pre> <p> <strong>Output:</strong> </p> <img src="//techcodeview.com/img/numpy-tutorial/36/numpy-random-python-19.webp" alt="numpy.random in Python"> <p> <strong>31) wald(mean, scale[, size])</strong> </p> <p>This function is used to draw sample from a Wald, or inverse Gaussian distribution.</p> <p> <strong>Example:</strong> </p> <pre> import numpy as np import matplotlib.pyplot as plt h = plt.hist(np.random.wald(3, 3, 100000), bins=250, density=True) plt.show() </pre> <p> <strong>Output:</strong> </p> <img src="//techcodeview.com/img/numpy-tutorial/36/numpy-random-python-20.webp" alt="numpy.random in Python"> <p> <strong>32) weibull(a[, size])</strong> </p> <p>This function is used to draw sample from a Weibull distribution.</p> <p> <strong>Example:</strong> </p> <pre> import numpy as np import matplotlib.pyplot as plt from scipy import special x=2.0 s=np.random.weibull(x, 1000) a = np.arange(1, 100.)/50. def weib(x, n, a): return (a/n)*(x/n)**np.exp(-(x/n)**a) count, bins, ignored = plt.hist(np.random.weibull(5.,1000)) a= np.arange(1,100.)/50. scale = count.max()/weib(x, 1., 5.).max() scale = count.max()/weib(a, 1., 5.).max() plt.plot(x, weib(x, 1., 5.)*scale) plt.show() </pre> <p> <strong>Output:</strong> </p> <img src="//techcodeview.com/img/numpy-tutorial/36/numpy-random-python-21.webp" alt="numpy.random in Python"> <p> <strong>33) zipf(a[, size])</strong> </p> <p>This function is used to draw sample from a Zipf distribution.</p> <p> <strong>Example:</strong> </p> <pre> import numpy as np import matplotlib.pyplot as plt from scipy import special x=2.0 s=np.random.zipf(x, 1000) count, bins, ignored = plt.hist(s[s<50], 50, density="True)" a="np.arange(1.," 50.) b="a**(-x)" special.zetac(x) plt.plot(a, max(b), linewidth="2," color="r" ) plt.show() < pre> <p> <strong>Output:</strong> </p> <img src="//techcodeview.com/img/numpy-tutorial/36/numpy-random-python-22.webp" alt="numpy.random in Python"> <hr></50],></pre></0)></pre></t)></pre></25)]></pre></0.01></pre></i)></pre></0.05:>
Išvestis:
array([0.00264041, 0.04725478, 0.07140803, 0.19526217, 0.23979 , 0.24023478, 0.63141254, 0.95316446, 1.40281789, 1.68327507])
7) gama (forma [, mastelis, dydis])
Ši funkcija naudojama imti iš gama skirstinio
Pavyzdys:
import numpy as np shape, scale = 2., 2. s1 = np.random.gamma(shape, scale, 1000) import matplotlib.pyplot as plt import scipy.special as spss count, bins, ignored = plt.hist(s1, 50, density=True) a = bins**(shape-1)*(np.exp(-bins/scale) / (spss.gamma(shape)*scale**shape)) plt.plot(bins, a, linewidth=2, color='r') plt.show()

8) geometrinis (p[, dydis])
Ši funkcija naudojama imti iš geometrinio skirstinio.
Pavyzdys:
import numpy as np a = np.random.geometric(p=0.35, size=10000) (a == 1).sum() / 1000
Išvestis:
3.
9) gumbel ([vieta, mastelis, dydis])
Ši funkcija naudojama paimti pavyzdį iš Gumble paskirstymo.
Pavyzdys:
import numpy as np lov, scale = 0, 0.2 s1 = np.random.gumbel(loc, scale, 1000) import matplotlib.pyplot as plt count, bins, ignored = plt.hist(s1, 30, density=True) plt.plot(bins, (1/beta)*np.exp(-(bins - loc)/beta)* np.exp( -np.exp( -(bins - loc) /beta) ),linewidth=2, color='r') plt.show()
Išvestis:

10) hipergeometrinis (netinkamas, netinkamas, pavyzdys[, dydis])
Ši funkcija naudojama imti iš hipergeometrinio skirstinio.
Pavyzdys:
import numpy as np good, bad, samp = 100, 2, 10 s1 = np.random.hypergeometric(good, bad, samp, 1000) plt.hist(s1) plt.show()
Išvestis:
(array([ 13., 0., 0., 0., 0., 163., 0., 0., 0., 824.]), array([ 8. , 8.2, 8.4, 8.6, 8.8, 9. , 9.2, 9.4, 9.6, 9.8, 10. ]), <a 10 list of patch objects>) </a>

11) laplasas ([vieta, mastelis, dydis])
Ši funkcija naudojama paimti pavyzdį iš Laplaso arba dvigubo eksponentinio skirstinio su nurodyta vieta ir mastu.
Pavyzdys:
import numpy as np location, scale = 0., 2. s = np.random.laplace(location, scale, 10) s
Išvestis:
array([-2.77127948, -1.46401453, -0.03723516, -1.61223942, 2.29590691, 1.74297722, 1.49438411, 0.30325513, -0.15948891, -4.99669747])
12) logistika ([vieta, mastelis, dydis])
Ši funkcija naudojama paimti pavyzdį iš logistikos paskirstymo.
Pavyzdys:
import numpy as np import matplotlib.pyplot as plt location, scale = 10, 1 s1 = np.random.logistic(location, scale, 10000) count, bins, ignored = plt.hist(s1, bins=50) count bins ignored plt.show()
Išvestis:
array([1.000e+00, 1.000e+00, 1.000e+00, 0.000e+00, 1.000e+00, 1.000e+00, 1.000e+00, 5.000e+00, 7.000e+00, 1.100e+01, 1.800e+01, 3.500e+01, 5.300e+01, 6.700e+01, 1.150e+02, 1.780e+02, 2.300e+02, 3.680e+02, 4.910e+02, 6.400e+02, 8.250e+02, 9.100e+02, 9.750e+02, 1.039e+03, 9.280e+02, 8.040e+02, 6.530e+02, 5.240e+02, 3.380e+02, 2.470e+02, 1.650e+02, 1.150e+02, 8.500e+01, 6.400e+01, 3.300e+01, 1.600e+01, 2.400e+01, 1.400e+01, 4.000e+00, 5.000e+00, 2.000e+00, 2.000e+00, 1.000e+00, 1.000e+00, 0.000e+00, 1.000e+00, 0.000e+00, 0.000e+00, 0.000e+00, 1.000e+00]) array([ 0.50643911, 0.91891814, 1.33139717, 1.7438762 , 2.15635523, 2.56883427, 2.9813133 , 3.39379233, 3.80627136, 4.2187504 , 4.63122943, 5.04370846, 5.45618749, 5.86866652, 6.28114556, 6.69362459, 7.10610362, 7.51858265, 7.93106169, 8.34354072, 8.75601975, 9.16849878, 9.58097781, 9.99345685, 10.40593588, 10.81841491, 11.23089394, 11.64337298, 12.05585201, 12.46833104, 12.88081007, 13.2932891 , 13.70576814, 14.11824717, 14.5307262 , 14.94320523, 15.35568427, 15.7681633 , 16.18064233, 16.59312136, 17.00560039, 17.41807943, 17.83055846, 18.24303749, 18.65551652, 19.06799556, 19.48047459, 19.89295362, 20.30543265, 20.71791168, 21.13039072]) <a 50 list of patch objects> </a>

13) lognormalus ([vidurkis, sigma, dydis])
Ši funkcija naudojama imti iš log-normalaus skirstinio.
Pavyzdys:
import numpy as np mu, sigma = 2., 1. s1 = np.random.lognormal(mu, sigma, 1000) import matplotlib.pyplot as plt count, bins, ignored = plt.hist(s1, 100, density=True, ) a = np.linspace(min(bins), max(bins), 10000) pdf = (np.exp(-(np.log(a) - mu)**2 / (2 * sigma**2))/ (a * sigma * np.sqrt(2 * np.pi))) plt.plot(a, pdf, linewidth=2, color='r') plt.axis('tight') plt.show()
Išvestis:

14) žurnalų serijos (p[, dydis])
Ši funkcija naudojama imti iš logaritminio skirstinio.
Pavyzdys:
import numpy as np x = .6 s1 = np.random.logseries(x, 10000) count, bins, ignored = plt.hist(s1) def logseries(k, p): return -p**k/(k*log(1-p)) plt.plot(bins, logseries(bins, x)*count.max()/logseries(bins, a).max(), 'r') plt.show()
Išvestis:

15) daugianaris (n, pvals[, dydis])
Ši funkcija naudojama imti iš daugianario skirstinio.
Pavyzdys:
import numpy as np np.random.multinomial(20, [1/6.]*6, size=1)
Išvestis:
array([[4, 2, 5, 5, 3, 1]])
16) multivariate_normal(vidurkis, cov[, dydis, ...)
Ši funkcija naudojama imti iš daugiamačio normalaus skirstinio.
Pavyzdys:
import numpy as np mean = (1, 2) coveriance = [[1, 0], [0, 100]] import matplotlib.pyplot as plt a, b = np.random.multivariate_normal(mean, coveriance, 5000).T plt.plot(a, b, 'x') plt.axis('equal'023 030 ) plt.show()
Išvestis:

17) neigiamas_binomas(n, p[, dydis])
Ši funkcija naudojama imti iš neigiamo dvinario skirstinio.
Pavyzdys:
import numpy as np s1 = np.random.negative_binomial(1, 0.1, 100000) for i in range(1, 11): probability = sum(s1 <i) 36 100000. print i, \'wells drilled, probability of one success=", probability </pre> <p> <strong>Output:</strong> </p> <pre> 1 wells drilled, probability of one success = 0 2 wells drilled, probability of one success = 0 3 wells drilled, probability of one success = 0 4 wells drilled, probability of one success = 0 5 wells drilled, probability of one success = 0 6 wells drilled, probability of one success = 0 7 wells drilled, probability of one success = 0 8 wells drilled, probability of one success = 0 9 wells drilled, probability of one success = 0 10 wells drilled, probability of one success = 0 </pre> <p > <strong>18) noncentral_chisquare(df, nonc[, size])</strong> </p> <p>This function is used to draw sample from a noncentral chi-square distribution. </p> <p> <strong>Example:</strong> </p> <pre> import numpy as np import matplotlib.pyplot as plt val = plt.hist(np.random.noncentral_chisquare(3, 25, 100000), bins=200, normed=True) plt.show() </pre> <p> <strong>Output:</strong> </p> <img src=" techcodeview.com img numpy-tutorial numpy-random-python-9.webp\' alt="numpy.random in Python"> <p> <strong>19) normal([loc, scale, size])</strong> </p> <p>This function is used to draw sample from a normal distribution.</p> <p> <strong>Example:</strong> </p> <pre> import numpy as np import matplotlib.pyplot as plt mu, sigma = 0, 0.2 # mean and standard deviation s1 = np.random.normal(mu, sigma, 1000) abs(mu - np.mean(s1)) <0.01 1 abs(sigma - np.std(s1, ddof="1))" < 0.01 count, bins, ignored="plt.hist(s1," 30, density="True)" plt.plot(bins, (sigma * np.sqrt(2 np.pi)) *np.exp( (bins mu)**2 (2 sigma**2) ), linewidth="2," color="r" ) plt.show() pre> <p> <strong>Output:</strong> </p> <img src="//techcodeview.com/img/numpy-tutorial/36/numpy-random-python-10.webp" alt="numpy.random in Python"> <p> <strong>20) pareto(a[, size])</strong> </p> <p>This function is used to draw samples from a Lomax or Pareto II with specified shape.</p> <p> <strong>Example:</strong> </p> <pre> import numpy as np import matplotlib.pyplot as plt b, m1 = 3., 2. # shape and mode s1 = (np.random.pareto(b, 1000) + 1) * m1 count, bins, _ = plt.hist(s1, 100, density=True) fit = b*m**b / bins**(b+1) plt.plot(bins, max(count)*fit/max(fit), linewidth=2, color='r') plt.show() </pre> <p> <strong>Output:</strong> </p> <img src="//techcodeview.com/img/numpy-tutorial/36/numpy-random-python-11.webp" alt="numpy.random in Python"> <p> <strong>21) power(a[, size])</strong> </p> <p>This function is used to draw samples in [0, 1] from a power distribution with positive exponent a-1.</p> <p> <strong>Example:</strong> </p> <pre> import numpy as np x = 5. # shape samples = 1000 s1 = np.random.power(x, samples) import matplotlib.pyplot as plt count, bins, ignored = plt.hist(s1, bins=30) a = np.linspace(0, 1, 100) b = x*a**(x-1.) density_b = samples*np.diff(bins)[0]*b plt.plot(a, density_b) plt.show() </pre> <p> <strong>Output:</strong> </p> <img src="//techcodeview.com/img/numpy-tutorial/36/numpy-random-python-12.webp" alt="numpy.random in Python"> <p> <strong>22) rayleigh([scale, size])</strong> </p> <p>This function is used to draw sample from a Rayleigh distribution.</p> <p> <strong>Example:</strong> </p> <pre> val = hist(np.random.rayleigh(3, 100000), bins=200, density=True) meanval = 1 modeval = np.sqrt(2 / np.pi) * meanval s1 = np.random.rayleigh(modeval, 1000000) 100.*sum(s1>3)/1000000. </pre> <p> <strong>Output:</strong> </p> <pre> 0.087300000000000003 </pre> <p><img src="//techcodeview.com/img/numpy-tutorial/36/numpy-random-python-13.webp" alt="numpy.random in Python"></p> <p> <strong>23) standard_cauchy([size])</strong> </p> <p>This function is used to draw sample from a standard Cauchy distribution with mode=0.</p> <p> <strong>Example:</strong> </p> <pre> import numpy as np import matplotlib.pyplot as plt s1 = np.random.standard_cauchy(1000000) s1 = s1[(s1>-25) & (s1<25)] # truncate distribution so it plots well plt.hist(s1, bins="100)" plt.show() < pre> <p> <strong>Output:</strong> </p> <img src="//techcodeview.com/img/numpy-tutorial/36/numpy-random-python-14.webp" alt="numpy.random in Python"> <p> <strong>24) standard_exponential([size])</strong> </p> <p>This function is used to draw sample from a standard exponential distribution.</p> <p> <strong>Example:</strong> </p> <pre> import numpy as np n = np.random.standard_exponential((2, 7000)) </pre> <p> <strong>Output:</strong> </p> <pre> array([[0.53857931, 0.181262 , 0.20478701, ..., 3.66232881, 1.83882709, 1.77963295], [0.65163973, 1.40001955, 0.7525986 , ..., 0.76516523, 0.8400617 , 0.88551011]]) </pre> <p> <strong>25) standard_gamma([size])</strong> </p> <p>This function is used to draw sample from a standard Gamma distribution.</p> <p> <strong>Example:</strong> </p> <pre> import numpy as np shape, scale = 2., 1. s1 = np.random.standard_gamma(shape, 1000000) import matplotlib.pyplot as plt import scipy.special as sps count1, bins1, ignored1 = plt.hist(s, 50, density=True) y = bins1**(shape-1) * ((np.exp(-bins1/scale))/ (sps.gamma(shape) * scale**shape)) plt.plot(bins1, y, linewidth=2, color='r') plt.show() </pre> <p> <strong>Output:</strong> </p> <img src="//techcodeview.com/img/numpy-tutorial/36/numpy-random-python-15.webp" alt="numpy.random in Python"> <p> <strong>26) standard_normal([size])</strong> </p> <p>This function is used to draw sample from a standard Normal distribution.</p> <p> <strong>Example:</strong> </p> <pre> import numpy as np import matplotlib.pyplot as plt s1= np.random.standard_normal(8000) s1 q = np.random.standard_normal(size=(3, 4, 2)) q </pre> <p> <strong>Output:</strong> </p> <pre> array([-3.14907597, 0.95366265, -1.20100026, ..., 3.47180222, 0.9608679 , 0.0774319 ]) array([[[ 1.55635461, -1.29541713], [-1.50534663, -0.02829194], [ 1.03949348, -0.26128132], [ 1.51921798, 0.82136178]], [[-0.4011052 , -0.52458858], [-1.31803814, 0.37415379], [-0.67077365, 0.97447018], [-0.20212115, 0.67840888]], [[ 1.86183474, 0.19946562], [-0.07376021, 0.84599701], [-0.84341386, 0.32081667], [-3.32016062, -1.19029818]]]) </pre> <p> <strong>27) standard_t(df[, size])</strong> </p> <p>This function is used to draw sample from a standard Student's distribution with df degree of freedom.</p> <p> <strong>Example:</strong> </p> <pre> intake = np.array([5260., 5470, 5640, 6180, 6390, 6515, 6805, 7515,8230,8770]) s1 = np.random.standard_t(10, size=100000) np.mean(intake) intake.std(ddof=1) t = (np.mean(intake)-7725)/(intake.std(ddof=1)/np.sqrt(len(intake))) h = plt.hist(s1, bins=100, density=True) np.sum(s1<t) float(len(s1)) plt.show() < pre> <p> <strong>Output:</strong> </p> <pre> 6677.5 1174.1101831694598 0.00864 </pre> <p><img src="//techcodeview.com/img/numpy-tutorial/36/numpy-random-python-16.webp" alt="numpy.random in Python"></p> <p> <strong>28) triangular(left, mode, right[, size])</strong> </p> <p>This function is used to draw sample from a triangular distribution over the interval.</p> <p> <strong>Example:</strong> </p> <pre> import numpy as np import matplotlib.pyplot as plt h = plt.hist(np.random.triangular(-4, 0, 8, 1000000), bins=300,density=True) plt.show() </pre> <p> <strong>Output:</strong> </p> <img src="//techcodeview.com/img/numpy-tutorial/36/numpy-random-python-17.webp" alt="numpy.random in Python"> <p> <strong>29) uniform([low, high, size])</strong> </p> <p>This function is used to draw sample from a uniform distribution.</p> <p> <strong>Example:</strong> </p> <pre> import numpy as np import matplotlib.pyplot as plt s1 = np.random.uniform(-1,0,1000) np.all(s1 >= -1) np.all(s1 <0) count, bins, ignored="plt.hist(s1," 15, density="True)" plt.plot(bins, np.ones_like(bins), linewidth="2," color="r" ) plt.show() < pre> <p> <strong>Output:</strong> </p> <img src="//techcodeview.com/img/numpy-tutorial/36/numpy-random-python-18.webp" alt="numpy.random in Python"> <p> <strong>30) vonmises(m1, m2[, size])</strong> </p> <p>This function is used to draw sample from a von Mises distribution.</p> <p> <strong>Example:</strong> </p> <pre> import numpy as np import matplotlib.pyplot as plt m1, m2 = 0.0, 4.0 s1 = np.random.vonmises(m1, m2, 1000) from scipy.special import i0 plt.hist(s1, 50, density=True) x = np.linspace(-np.pi, np.pi, num=51) y = np.exp(m2*np.cos(x-m1))/(2*np.pi*i0(m2)) plt.plot(x, y, linewidth=2, color='r') plt.show() </pre> <p> <strong>Output:</strong> </p> <img src="//techcodeview.com/img/numpy-tutorial/36/numpy-random-python-19.webp" alt="numpy.random in Python"> <p> <strong>31) wald(mean, scale[, size])</strong> </p> <p>This function is used to draw sample from a Wald, or inverse Gaussian distribution.</p> <p> <strong>Example:</strong> </p> <pre> import numpy as np import matplotlib.pyplot as plt h = plt.hist(np.random.wald(3, 3, 100000), bins=250, density=True) plt.show() </pre> <p> <strong>Output:</strong> </p> <img src="//techcodeview.com/img/numpy-tutorial/36/numpy-random-python-20.webp" alt="numpy.random in Python"> <p> <strong>32) weibull(a[, size])</strong> </p> <p>This function is used to draw sample from a Weibull distribution.</p> <p> <strong>Example:</strong> </p> <pre> import numpy as np import matplotlib.pyplot as plt from scipy import special x=2.0 s=np.random.weibull(x, 1000) a = np.arange(1, 100.)/50. def weib(x, n, a): return (a/n)*(x/n)**np.exp(-(x/n)**a) count, bins, ignored = plt.hist(np.random.weibull(5.,1000)) a= np.arange(1,100.)/50. scale = count.max()/weib(x, 1., 5.).max() scale = count.max()/weib(a, 1., 5.).max() plt.plot(x, weib(x, 1., 5.)*scale) plt.show() </pre> <p> <strong>Output:</strong> </p> <img src="//techcodeview.com/img/numpy-tutorial/36/numpy-random-python-21.webp" alt="numpy.random in Python"> <p> <strong>33) zipf(a[, size])</strong> </p> <p>This function is used to draw sample from a Zipf distribution.</p> <p> <strong>Example:</strong> </p> <pre> import numpy as np import matplotlib.pyplot as plt from scipy import special x=2.0 s=np.random.zipf(x, 1000) count, bins, ignored = plt.hist(s[s<50], 50, density="True)" a="np.arange(1.," 50.) b="a**(-x)" special.zetac(x) plt.plot(a, max(b), linewidth="2," color="r" ) plt.show() < pre> <p> <strong>Output:</strong> </p> <img src="//techcodeview.com/img/numpy-tutorial/36/numpy-random-python-22.webp" alt="numpy.random in Python"> <hr></50],></pre></0)></pre></t)></pre></25)]></pre></0.01></pre></i)>
Išvestis:

21) galia (a[, dydis])
Ši funkcija naudojama imti [0, 1] iš galios paskirstymo su teigiamu eksponentu a-1.
Pavyzdys:
import numpy as np x = 5. # shape samples = 1000 s1 = np.random.power(x, samples) import matplotlib.pyplot as plt count, bins, ignored = plt.hist(s1, bins=30) a = np.linspace(0, 1, 100) b = x*a**(x-1.) density_b = samples*np.diff(bins)[0]*b plt.plot(a, density_b) plt.show()
Išvestis:

22) rayeigh ([mastas, dydis])
Ši funkcija naudojama imti iš Rayleigh skirstinio.
Pavyzdys:
val = hist(np.random.rayleigh(3, 100000), bins=200, density=True) meanval = 1 modeval = np.sqrt(2 / np.pi) * meanval s1 = np.random.rayleigh(modeval, 1000000) 100.*sum(s1>3)/1000000.
Išvestis:
0.087300000000000003

23) standartinis_cauchy([dydis])
Ši funkcija naudojama imti iš standartinio Cauchy skirstinio, kurio režimas = 0.
Pavyzdys:
import numpy as np import matplotlib.pyplot as plt s1 = np.random.standard_cauchy(1000000) s1 = s1[(s1>-25) & (s1<25)] # truncate distribution so it plots well plt.hist(s1, bins="100)" plt.show() < pre> <p> <strong>Output:</strong> </p> <img src="//techcodeview.com/img/numpy-tutorial/36/numpy-random-python-14.webp" alt="numpy.random in Python"> <p> <strong>24) standard_exponential([size])</strong> </p> <p>This function is used to draw sample from a standard exponential distribution.</p> <p> <strong>Example:</strong> </p> <pre> import numpy as np n = np.random.standard_exponential((2, 7000)) </pre> <p> <strong>Output:</strong> </p> <pre> array([[0.53857931, 0.181262 , 0.20478701, ..., 3.66232881, 1.83882709, 1.77963295], [0.65163973, 1.40001955, 0.7525986 , ..., 0.76516523, 0.8400617 , 0.88551011]]) </pre> <p> <strong>25) standard_gamma([size])</strong> </p> <p>This function is used to draw sample from a standard Gamma distribution.</p> <p> <strong>Example:</strong> </p> <pre> import numpy as np shape, scale = 2., 1. s1 = np.random.standard_gamma(shape, 1000000) import matplotlib.pyplot as plt import scipy.special as sps count1, bins1, ignored1 = plt.hist(s, 50, density=True) y = bins1**(shape-1) * ((np.exp(-bins1/scale))/ (sps.gamma(shape) * scale**shape)) plt.plot(bins1, y, linewidth=2, color='r') plt.show() </pre> <p> <strong>Output:</strong> </p> <img src="//techcodeview.com/img/numpy-tutorial/36/numpy-random-python-15.webp" alt="numpy.random in Python"> <p> <strong>26) standard_normal([size])</strong> </p> <p>This function is used to draw sample from a standard Normal distribution.</p> <p> <strong>Example:</strong> </p> <pre> import numpy as np import matplotlib.pyplot as plt s1= np.random.standard_normal(8000) s1 q = np.random.standard_normal(size=(3, 4, 2)) q </pre> <p> <strong>Output:</strong> </p> <pre> array([-3.14907597, 0.95366265, -1.20100026, ..., 3.47180222, 0.9608679 , 0.0774319 ]) array([[[ 1.55635461, -1.29541713], [-1.50534663, -0.02829194], [ 1.03949348, -0.26128132], [ 1.51921798, 0.82136178]], [[-0.4011052 , -0.52458858], [-1.31803814, 0.37415379], [-0.67077365, 0.97447018], [-0.20212115, 0.67840888]], [[ 1.86183474, 0.19946562], [-0.07376021, 0.84599701], [-0.84341386, 0.32081667], [-3.32016062, -1.19029818]]]) </pre> <p> <strong>27) standard_t(df[, size])</strong> </p> <p>This function is used to draw sample from a standard Student's distribution with df degree of freedom.</p> <p> <strong>Example:</strong> </p> <pre> intake = np.array([5260., 5470, 5640, 6180, 6390, 6515, 6805, 7515,8230,8770]) s1 = np.random.standard_t(10, size=100000) np.mean(intake) intake.std(ddof=1) t = (np.mean(intake)-7725)/(intake.std(ddof=1)/np.sqrt(len(intake))) h = plt.hist(s1, bins=100, density=True) np.sum(s1<t) float(len(s1)) plt.show() < pre> <p> <strong>Output:</strong> </p> <pre> 6677.5 1174.1101831694598 0.00864 </pre> <p><img src="//techcodeview.com/img/numpy-tutorial/36/numpy-random-python-16.webp" alt="numpy.random in Python"></p> <p> <strong>28) triangular(left, mode, right[, size])</strong> </p> <p>This function is used to draw sample from a triangular distribution over the interval.</p> <p> <strong>Example:</strong> </p> <pre> import numpy as np import matplotlib.pyplot as plt h = plt.hist(np.random.triangular(-4, 0, 8, 1000000), bins=300,density=True) plt.show() </pre> <p> <strong>Output:</strong> </p> <img src="//techcodeview.com/img/numpy-tutorial/36/numpy-random-python-17.webp" alt="numpy.random in Python"> <p> <strong>29) uniform([low, high, size])</strong> </p> <p>This function is used to draw sample from a uniform distribution.</p> <p> <strong>Example:</strong> </p> <pre> import numpy as np import matplotlib.pyplot as plt s1 = np.random.uniform(-1,0,1000) np.all(s1 >= -1) np.all(s1 <0) count, bins, ignored="plt.hist(s1," 15, density="True)" plt.plot(bins, np.ones_like(bins), linewidth="2," color="r" ) plt.show() < pre> <p> <strong>Output:</strong> </p> <img src="//techcodeview.com/img/numpy-tutorial/36/numpy-random-python-18.webp" alt="numpy.random in Python"> <p> <strong>30) vonmises(m1, m2[, size])</strong> </p> <p>This function is used to draw sample from a von Mises distribution.</p> <p> <strong>Example:</strong> </p> <pre> import numpy as np import matplotlib.pyplot as plt m1, m2 = 0.0, 4.0 s1 = np.random.vonmises(m1, m2, 1000) from scipy.special import i0 plt.hist(s1, 50, density=True) x = np.linspace(-np.pi, np.pi, num=51) y = np.exp(m2*np.cos(x-m1))/(2*np.pi*i0(m2)) plt.plot(x, y, linewidth=2, color='r') plt.show() </pre> <p> <strong>Output:</strong> </p> <img src="//techcodeview.com/img/numpy-tutorial/36/numpy-random-python-19.webp" alt="numpy.random in Python"> <p> <strong>31) wald(mean, scale[, size])</strong> </p> <p>This function is used to draw sample from a Wald, or inverse Gaussian distribution.</p> <p> <strong>Example:</strong> </p> <pre> import numpy as np import matplotlib.pyplot as plt h = plt.hist(np.random.wald(3, 3, 100000), bins=250, density=True) plt.show() </pre> <p> <strong>Output:</strong> </p> <img src="//techcodeview.com/img/numpy-tutorial/36/numpy-random-python-20.webp" alt="numpy.random in Python"> <p> <strong>32) weibull(a[, size])</strong> </p> <p>This function is used to draw sample from a Weibull distribution.</p> <p> <strong>Example:</strong> </p> <pre> import numpy as np import matplotlib.pyplot as plt from scipy import special x=2.0 s=np.random.weibull(x, 1000) a = np.arange(1, 100.)/50. def weib(x, n, a): return (a/n)*(x/n)**np.exp(-(x/n)**a) count, bins, ignored = plt.hist(np.random.weibull(5.,1000)) a= np.arange(1,100.)/50. scale = count.max()/weib(x, 1., 5.).max() scale = count.max()/weib(a, 1., 5.).max() plt.plot(x, weib(x, 1., 5.)*scale) plt.show() </pre> <p> <strong>Output:</strong> </p> <img src="//techcodeview.com/img/numpy-tutorial/36/numpy-random-python-21.webp" alt="numpy.random in Python"> <p> <strong>33) zipf(a[, size])</strong> </p> <p>This function is used to draw sample from a Zipf distribution.</p> <p> <strong>Example:</strong> </p> <pre> import numpy as np import matplotlib.pyplot as plt from scipy import special x=2.0 s=np.random.zipf(x, 1000) count, bins, ignored = plt.hist(s[s<50], 50, density="True)" a="np.arange(1.," 50.) b="a**(-x)" special.zetac(x) plt.plot(a, max(b), linewidth="2," color="r" ) plt.show() < pre> <p> <strong>Output:</strong> </p> <img src="//techcodeview.com/img/numpy-tutorial/36/numpy-random-python-22.webp" alt="numpy.random in Python"> <hr></50],></pre></0)></pre></t)></pre></25)]>
Išvestis:
array([[0.53857931, 0.181262 , 0.20478701, ..., 3.66232881, 1.83882709, 1.77963295], [0.65163973, 1.40001955, 0.7525986 , ..., 0.76516523, 0.8400617 , 0.88551011]])
25) standartinis_gama([dydis])
Ši funkcija naudojama imti iš standartinio gama skirstinio.
Pavyzdys:
import numpy as np shape, scale = 2., 1. s1 = np.random.standard_gamma(shape, 1000000) import matplotlib.pyplot as plt import scipy.special as sps count1, bins1, ignored1 = plt.hist(s, 50, density=True) y = bins1**(shape-1) * ((np.exp(-bins1/scale))/ (sps.gamma(shape) * scale**shape)) plt.plot(bins1, y, linewidth=2, color='r') plt.show()
Išvestis:

26) standartinis_normalus([dydis])
Ši funkcija naudojama imti iš standartinio normalaus skirstinio.
Pavyzdys:
import numpy as np import matplotlib.pyplot as plt s1= np.random.standard_normal(8000) s1 q = np.random.standard_normal(size=(3, 4, 2)) q
Išvestis:
array([-3.14907597, 0.95366265, -1.20100026, ..., 3.47180222, 0.9608679 , 0.0774319 ]) array([[[ 1.55635461, -1.29541713], [-1.50534663, -0.02829194], [ 1.03949348, -0.26128132], [ 1.51921798, 0.82136178]], [[-0.4011052 , -0.52458858], [-1.31803814, 0.37415379], [-0.67077365, 0.97447018], [-0.20212115, 0.67840888]], [[ 1.86183474, 0.19946562], [-0.07376021, 0.84599701], [-0.84341386, 0.32081667], [-3.32016062, -1.19029818]]])
27) standartinis_t(df[, dydis])
Ši funkcija naudojama imti iš standartinio Stjudento skirstinio su df laisvės laipsniu.
Pavyzdys:
intake = np.array([5260., 5470, 5640, 6180, 6390, 6515, 6805, 7515,8230,8770]) s1 = np.random.standard_t(10, size=100000) np.mean(intake) intake.std(ddof=1) t = (np.mean(intake)-7725)/(intake.std(ddof=1)/np.sqrt(len(intake))) h = plt.hist(s1, bins=100, density=True) np.sum(s1<t) float(len(s1)) plt.show() < pre> <p> <strong>Output:</strong> </p> <pre> 6677.5 1174.1101831694598 0.00864 </pre> <p><img src="//techcodeview.com/img/numpy-tutorial/36/numpy-random-python-16.webp" alt="numpy.random in Python"></p> <p> <strong>28) triangular(left, mode, right[, size])</strong> </p> <p>This function is used to draw sample from a triangular distribution over the interval.</p> <p> <strong>Example:</strong> </p> <pre> import numpy as np import matplotlib.pyplot as plt h = plt.hist(np.random.triangular(-4, 0, 8, 1000000), bins=300,density=True) plt.show() </pre> <p> <strong>Output:</strong> </p> <img src="//techcodeview.com/img/numpy-tutorial/36/numpy-random-python-17.webp" alt="numpy.random in Python"> <p> <strong>29) uniform([low, high, size])</strong> </p> <p>This function is used to draw sample from a uniform distribution.</p> <p> <strong>Example:</strong> </p> <pre> import numpy as np import matplotlib.pyplot as plt s1 = np.random.uniform(-1,0,1000) np.all(s1 >= -1) np.all(s1 <0) count, bins, ignored="plt.hist(s1," 15, density="True)" plt.plot(bins, np.ones_like(bins), linewidth="2," color="r" ) plt.show() < pre> <p> <strong>Output:</strong> </p> <img src="//techcodeview.com/img/numpy-tutorial/36/numpy-random-python-18.webp" alt="numpy.random in Python"> <p> <strong>30) vonmises(m1, m2[, size])</strong> </p> <p>This function is used to draw sample from a von Mises distribution.</p> <p> <strong>Example:</strong> </p> <pre> import numpy as np import matplotlib.pyplot as plt m1, m2 = 0.0, 4.0 s1 = np.random.vonmises(m1, m2, 1000) from scipy.special import i0 plt.hist(s1, 50, density=True) x = np.linspace(-np.pi, np.pi, num=51) y = np.exp(m2*np.cos(x-m1))/(2*np.pi*i0(m2)) plt.plot(x, y, linewidth=2, color='r') plt.show() </pre> <p> <strong>Output:</strong> </p> <img src="//techcodeview.com/img/numpy-tutorial/36/numpy-random-python-19.webp" alt="numpy.random in Python"> <p> <strong>31) wald(mean, scale[, size])</strong> </p> <p>This function is used to draw sample from a Wald, or inverse Gaussian distribution.</p> <p> <strong>Example:</strong> </p> <pre> import numpy as np import matplotlib.pyplot as plt h = plt.hist(np.random.wald(3, 3, 100000), bins=250, density=True) plt.show() </pre> <p> <strong>Output:</strong> </p> <img src="//techcodeview.com/img/numpy-tutorial/36/numpy-random-python-20.webp" alt="numpy.random in Python"> <p> <strong>32) weibull(a[, size])</strong> </p> <p>This function is used to draw sample from a Weibull distribution.</p> <p> <strong>Example:</strong> </p> <pre> import numpy as np import matplotlib.pyplot as plt from scipy import special x=2.0 s=np.random.weibull(x, 1000) a = np.arange(1, 100.)/50. def weib(x, n, a): return (a/n)*(x/n)**np.exp(-(x/n)**a) count, bins, ignored = plt.hist(np.random.weibull(5.,1000)) a= np.arange(1,100.)/50. scale = count.max()/weib(x, 1., 5.).max() scale = count.max()/weib(a, 1., 5.).max() plt.plot(x, weib(x, 1., 5.)*scale) plt.show() </pre> <p> <strong>Output:</strong> </p> <img src="//techcodeview.com/img/numpy-tutorial/36/numpy-random-python-21.webp" alt="numpy.random in Python"> <p> <strong>33) zipf(a[, size])</strong> </p> <p>This function is used to draw sample from a Zipf distribution.</p> <p> <strong>Example:</strong> </p> <pre> import numpy as np import matplotlib.pyplot as plt from scipy import special x=2.0 s=np.random.zipf(x, 1000) count, bins, ignored = plt.hist(s[s<50], 50, density="True)" a="np.arange(1.," 50.) b="a**(-x)" special.zetac(x) plt.plot(a, max(b), linewidth="2," color="r" ) plt.show() < pre> <p> <strong>Output:</strong> </p> <img src="//techcodeview.com/img/numpy-tutorial/36/numpy-random-python-22.webp" alt="numpy.random in Python"> <hr></50],></pre></0)></pre></t)>

28) trikampis (kairė, režimas, dešinė[, dydis])
Ši funkcija naudojama imti iš trikampio pasiskirstymo per intervalą.
Pavyzdys:
import numpy as np import matplotlib.pyplot as plt h = plt.hist(np.random.triangular(-4, 0, 8, 1000000), bins=300,density=True) plt.show()
Išvestis:

29) uniforma ([žemas, aukštas, dydis])
Ši funkcija naudojama imti iš vienodo skirstinio.
Pavyzdys:
import numpy as np import matplotlib.pyplot as plt s1 = np.random.uniform(-1,0,1000) np.all(s1 >= -1) np.all(s1 <0) count, bins, ignored="plt.hist(s1," 15, density="True)" plt.plot(bins, np.ones_like(bins), linewidth="2," color="r" ) plt.show() < pre> <p> <strong>Output:</strong> </p> <img src="//techcodeview.com/img/numpy-tutorial/36/numpy-random-python-18.webp" alt="numpy.random in Python"> <p> <strong>30) vonmises(m1, m2[, size])</strong> </p> <p>This function is used to draw sample from a von Mises distribution.</p> <p> <strong>Example:</strong> </p> <pre> import numpy as np import matplotlib.pyplot as plt m1, m2 = 0.0, 4.0 s1 = np.random.vonmises(m1, m2, 1000) from scipy.special import i0 plt.hist(s1, 50, density=True) x = np.linspace(-np.pi, np.pi, num=51) y = np.exp(m2*np.cos(x-m1))/(2*np.pi*i0(m2)) plt.plot(x, y, linewidth=2, color='r') plt.show() </pre> <p> <strong>Output:</strong> </p> <img src="//techcodeview.com/img/numpy-tutorial/36/numpy-random-python-19.webp" alt="numpy.random in Python"> <p> <strong>31) wald(mean, scale[, size])</strong> </p> <p>This function is used to draw sample from a Wald, or inverse Gaussian distribution.</p> <p> <strong>Example:</strong> </p> <pre> import numpy as np import matplotlib.pyplot as plt h = plt.hist(np.random.wald(3, 3, 100000), bins=250, density=True) plt.show() </pre> <p> <strong>Output:</strong> </p> <img src="//techcodeview.com/img/numpy-tutorial/36/numpy-random-python-20.webp" alt="numpy.random in Python"> <p> <strong>32) weibull(a[, size])</strong> </p> <p>This function is used to draw sample from a Weibull distribution.</p> <p> <strong>Example:</strong> </p> <pre> import numpy as np import matplotlib.pyplot as plt from scipy import special x=2.0 s=np.random.weibull(x, 1000) a = np.arange(1, 100.)/50. def weib(x, n, a): return (a/n)*(x/n)**np.exp(-(x/n)**a) count, bins, ignored = plt.hist(np.random.weibull(5.,1000)) a= np.arange(1,100.)/50. scale = count.max()/weib(x, 1., 5.).max() scale = count.max()/weib(a, 1., 5.).max() plt.plot(x, weib(x, 1., 5.)*scale) plt.show() </pre> <p> <strong>Output:</strong> </p> <img src="//techcodeview.com/img/numpy-tutorial/36/numpy-random-python-21.webp" alt="numpy.random in Python"> <p> <strong>33) zipf(a[, size])</strong> </p> <p>This function is used to draw sample from a Zipf distribution.</p> <p> <strong>Example:</strong> </p> <pre> import numpy as np import matplotlib.pyplot as plt from scipy import special x=2.0 s=np.random.zipf(x, 1000) count, bins, ignored = plt.hist(s[s<50], 50, density="True)" a="np.arange(1.," 50.) b="a**(-x)" special.zetac(x) plt.plot(a, max(b), linewidth="2," color="r" ) plt.show() < pre> <p> <strong>Output:</strong> </p> <img src="//techcodeview.com/img/numpy-tutorial/36/numpy-random-python-22.webp" alt="numpy.random in Python"> <hr></50],></pre></0)>
Išvestis:

31) wald(vidurkis, mastelis[, dydis])
Ši funkcija naudojama imti iš Wald arba atvirkštinio Gauso skirstinio.
Pavyzdys:
import numpy as np import matplotlib.pyplot as plt h = plt.hist(np.random.wald(3, 3, 100000), bins=250, density=True) plt.show()
Išvestis:

32) Weibull(a[, dydis])
Ši funkcija naudojama imti imtį iš Weibull skirstinio.
Pavyzdys:
import numpy as np import matplotlib.pyplot as plt from scipy import special x=2.0 s=np.random.weibull(x, 1000) a = np.arange(1, 100.)/50. def weib(x, n, a): return (a/n)*(x/n)**np.exp(-(x/n)**a) count, bins, ignored = plt.hist(np.random.weibull(5.,1000)) a= np.arange(1,100.)/50. scale = count.max()/weib(x, 1., 5.).max() scale = count.max()/weib(a, 1., 5.).max() plt.plot(x, weib(x, 1., 5.)*scale) plt.show()
Išvestis:

33) zipf (a[, dydis])
Ši funkcija naudojama paimti pavyzdį iš Zipf paskirstymo.
Pavyzdys:
import numpy as np import matplotlib.pyplot as plt from scipy import special x=2.0 s=np.random.zipf(x, 1000) count, bins, ignored = plt.hist(s[s<50], 50, density="True)" a="np.arange(1.," 50.) b="a**(-x)" special.zetac(x) plt.plot(a, max(b), linewidth="2," color="r" ) plt.show() < pre> <p> <strong>Output:</strong> </p> <img src="//techcodeview.com/img/numpy-tutorial/36/numpy-random-python-22.webp" alt="numpy.random in Python"> <hr></50],>